A Big Data Perspective on the Behaviour of Copper in Arc Magmas
Barber N., Edmonds M., Jenner F., Williams H. & Audetat A.
Session 04d: Chalcophile, siderophile, and other redox-sensitive elements in the solid Earth
Friday, June 26 05:30 – 06:30 – Discussion @ 06:12 GMT
Are there generic petrological controls on magmatic Cu abundances, and which combination of processes seem to favor the formation of ‘porphyry-fertile’ magmas?
What did we do?
We constructed a novel geochemical, geophysical, and geological database of to appraise the global systematics of Cu in arc magmas. Our database was assembled using Python and QGIS. This database comprises 55,000+ records with 200+ unique variables across 17 arcs.
Why does it matter?
Early sulphide saturation in arc magmas, under optimal tectonic conditions and in the presence of repeated amphibole fractionation, promotes ore fertility. These insights point to the promise of Big Data in petrology.
What did we find?
Calc-alkaline differentiation of arc magmas under moderately thick crust leads to depleted Cu concentrations. Our multi-factor approach allows us to see this depletion as a product of prolonged amphibole fractionation, which promotes early sulphide fractionation.
What’s Next?
We plan to validate this global model with a regional study in Java, Indonesia. We will apply a combination of field geology, microanalysis, and stable isotopes to be constrain the timing and tectonic controls on Cu depletion.
ALL FIGURES FROM Barber et al. (2020) in preparation.
Color schemes used for all color bars are from Scientific Color Maps – check them out!!
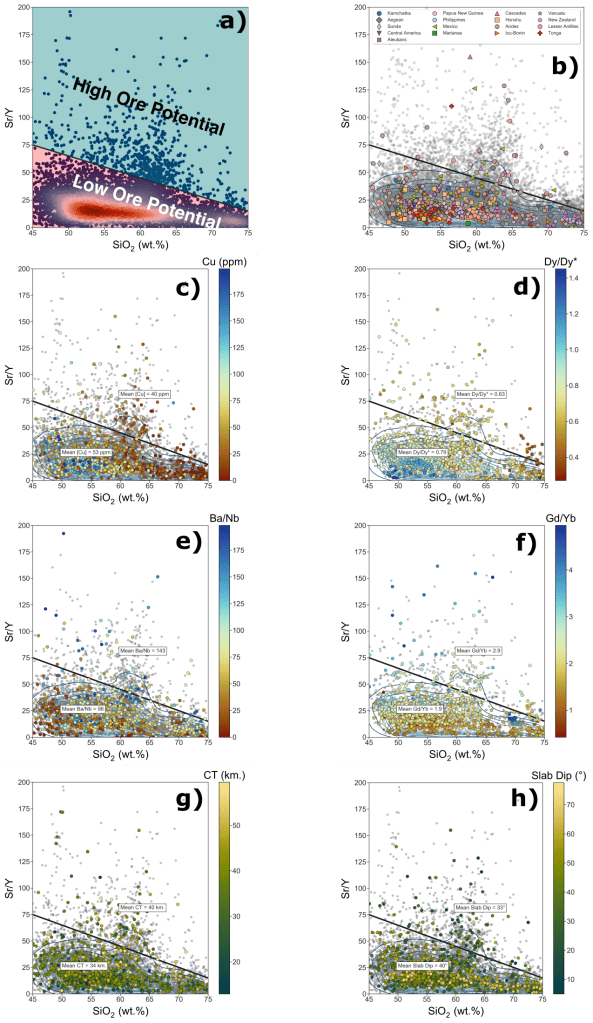
Figure 1: Series of scatter plots colored for different parameters in our database, comparing SiO2 (wt. %) to Sr/Y, where Sr/Y is a geochemical ratio used to indicate ore fertility, following Loucks et al. 2014. Strontium (Sr) is a light ion lithophile (LILE), and Yttrium (Y) is a high field-strength element (HFSE). The abundances of these elements in magma are controlled by the crystallization of plagioclase and amphibole/garnet (respectively). The black line in each plot separates a “high” from a “low” ore potential field.
The different show subsamples colored/symbolized by b) subduction zone, c) Cu (ppm), d) Dy/Dy* (see Figure 3), e) Ba/Nb (see below), f) Gd/Yb (proxy for garnet fractionation), g) Crustal Thickness or CT (km.), and h) slab dip.
Key Observations: The data strongly indicate that the involvement of garnet (either in the source or as a fractionating phase, which modifies Gd/Yb), amphibole fractionation (which lowers Dy/Dy*), and hydrous slab fluids (Ba/Nb) are essential geochemical preconditions to the generation of ore fertile magmas, especially under thick crust.
Main Takeaways: A variety of factors influence [Cu] in arc magmas. We can explore these factors below, but thanks to Sr/Y, we can explore these factors with a good idea of what constitutes ore fertility.
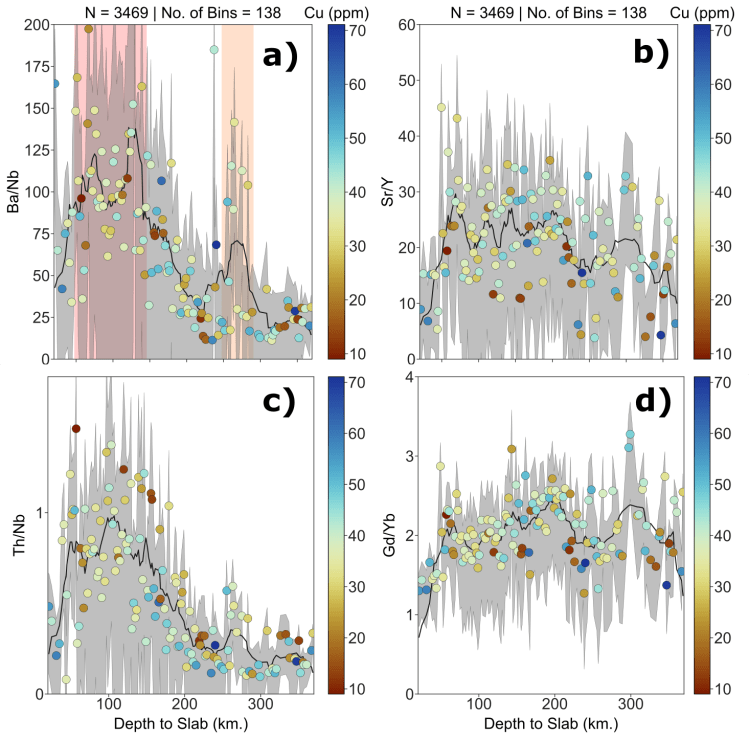
Figure 2: Global geochemical indicators plotted against depth to slab (DTS). DTS derived from Hayes et al. 2018. Subplots show moving averages of a) Ba/Nb, b) Sr/Y, Th/Nb, and d) Gd/Yb, all colored for [Cu]. Points on plots are binned averages of each indicator grouped into 5 km bins. Ba/Nb is an indicator for subcritical fluid flux (see Pearce et al. 2005), Th/Nb a proxy for sediment flux from the slab (Pearce et al. 2005), and Gd/Yb is a proxy for garnet (Müntener et al. 2001). Red and orange bars in plot a) indicate hypothesized breakdown depths of antigorite (see Iacovino et al. 2020) and phlogopite (see Sudo et al. 1990) in the descending slab.
Key Observations: Ba/Nb experiences two discrete peaks at 100 and 250 km. DTS; Th/Nb matches the first peak at 100 km. We hypothesize these peaks correspond to the respective breakdown of the hydrous minerals mentioned above. Further work is needed to confirm this. Despite Sr/Y and Gd/Yb’s strong association with magmatic water content, there seems to be no relationship between these two indicators and DTS.
Main Takeaways: As expected, Cu content in a magma does not correlate with fluid flux from the subjecting slab. We demonstrate there are global systematics for de-volatilization in subduction zones, that may consistent with the breakdown of specific hydrous minerals. We hope to explore this relationship more in future work.

Figure 3: Scatter plots showing the rare earth element (REE) systematics of magmas in our database. Upper two plots show the expected behavior of these geochemical indies in response to petrological processes, following the models of Davidson et al. 2013. Left-hand panel is colored for [Cu] in ppm, right hand panel is colored for Crustal Thickness (CT) in km.
The different plots are grouped into different crustal thickness categories, where the database is filtered for samples corresponding to Thin (< 30 km. – plots a. and b.), Average (30-40 km. – plots c. and d.), and Thick (> 40 km. – plots e. and f.) continental crust. From each category, roughly 400 magmas are plotted to show the relevant trends. The number of points displayed in each category is shown in the bottom right of the crustal thickness plots (plots b, d, f), and the mean [Cu] and [MgO] from each crustal thickness category are given in the bottom right of the [Cu] plots (plots a, c, e).
Brief summary of Dy Index: Dy is a Middle Rare Earth Element, or MREE, and Yb a Heavy Rare Earth Element, or HREE. Based on their mass alone, rare earth elements partition very differently into different minerals, with MREE’s strongly favored in minerals like amphibole and clinopyroxene, and HREE’s favored in garnet. (Dy/Dy*) measures the shape of an REE profile with respect to Dy. (Dy/Yb) measures the relative enrichment/depletion between a the model MREE Dy and model HREE Yb. For a full discussion of the systematics and calculation methods, see Davidson et al. 2013.
Key Observations: As crustal thickness decreases, amphibole and clinopyroxene fractionation become more common. Similarly, more magma seems to be melting out of garnet-bearing source regions (as a function of water and pressure; see Alonso-Perez et al. 2009). These amphibole-rich and garnet-source derived magmas also have the lowest [Cu]. The lower average [Cu] in plots e. and f. (Thick Crust) is statistically significantly different from the other 2 crustal groups (Thin and Average). Finally, the [MgO] is unchanged regardless of these processes, suggesting the observed decrease in [Cu] with crustal thickness is not a function of fractionation alone.
Main Takeaway: Magmas with low [Cu] see abundant amphibole + cpx fractionation, combined with melting under a thick crust in a garnet-bearing source region. Crucially, these low [Cu] magmas also have the highest Sr/Y. What does amphibole fractionation and garnet-source melting have to do with these magmas that leads them to both 1) develop lower [Cu] and yet 2) build up higher ore fertility?

Figure 4: Scatter plot showing differentiation trends in our arc magma database, comparing MgO to FeO (wt. %). In all, 4371 arc magmas contain measurable FeO, MgO, CT, and Cu concentrations. The broad scatter of this data (shown as the grey cloud in the plot background) is reduced by binning the data into 0.05 wt. % MgO buckets (215 bins total), and computing the average Cu, CT, FeO, and MgO in each bucket. a) Colored for [Cu], filtered for magmas with [Cu] < 150 ppm. b) Colored for CT, where CT < 70 km.
Key Observations: [Cu] responds strongly to decreasing FeO and MgO content, Like in Figure 1, lower [Cu] magmas are found in thicker continental crust. The lowest [Cu] magmas tracks calc-alkaline (CA) differentiation – where Fe linearly decrease with Mg. If extreme amphibole fractionation occurs coevally with high CA differentiation, the subsequent significant Fe-depletion trend could be driving sulphide saturation, as sulphide is saturation is strongly controlled by FeO.
Main Takeaway: [Cu] is strongly affected by differentiation, and is most depleted in thick crust. We believe this is a function of amphibole fractionation lowering [FeO], which stabilizes sulphide, decreasing [Cu] in the magma. Consequently early sulphide saturation seems to be essential to make a porphyry fertile magma.
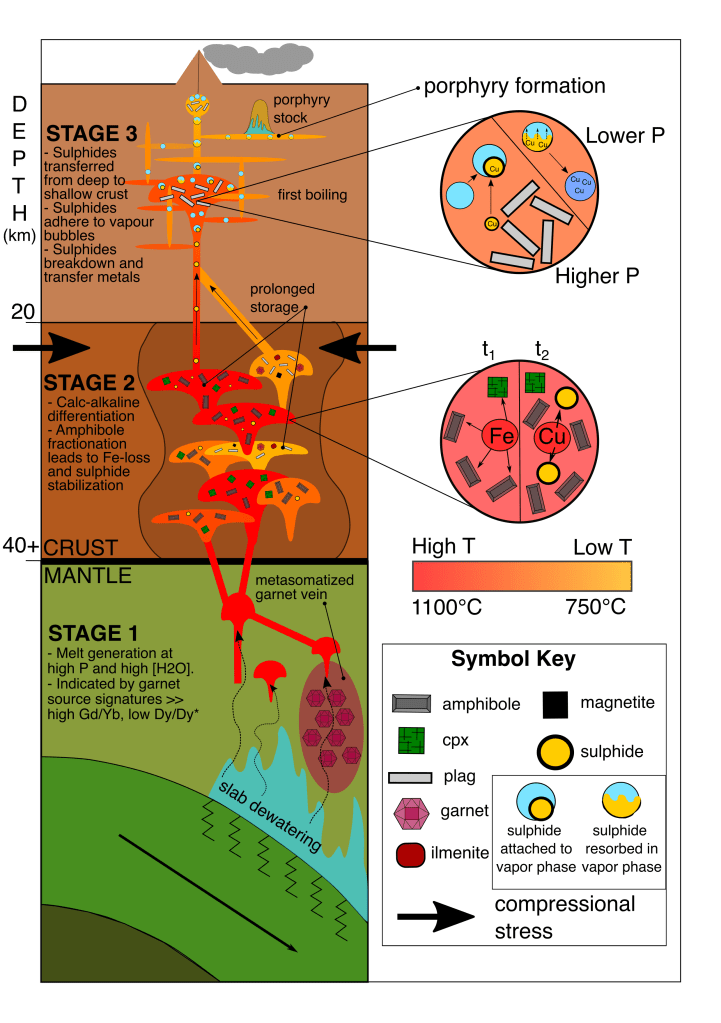
Figure 5: Our model for resolving the ‘Cu paradox,’ in arc magmas (see Lee et al. 2020). This model is based on both the information presented in our presentation, and the data shown above.
